Click here to download example files
Mainly commands:
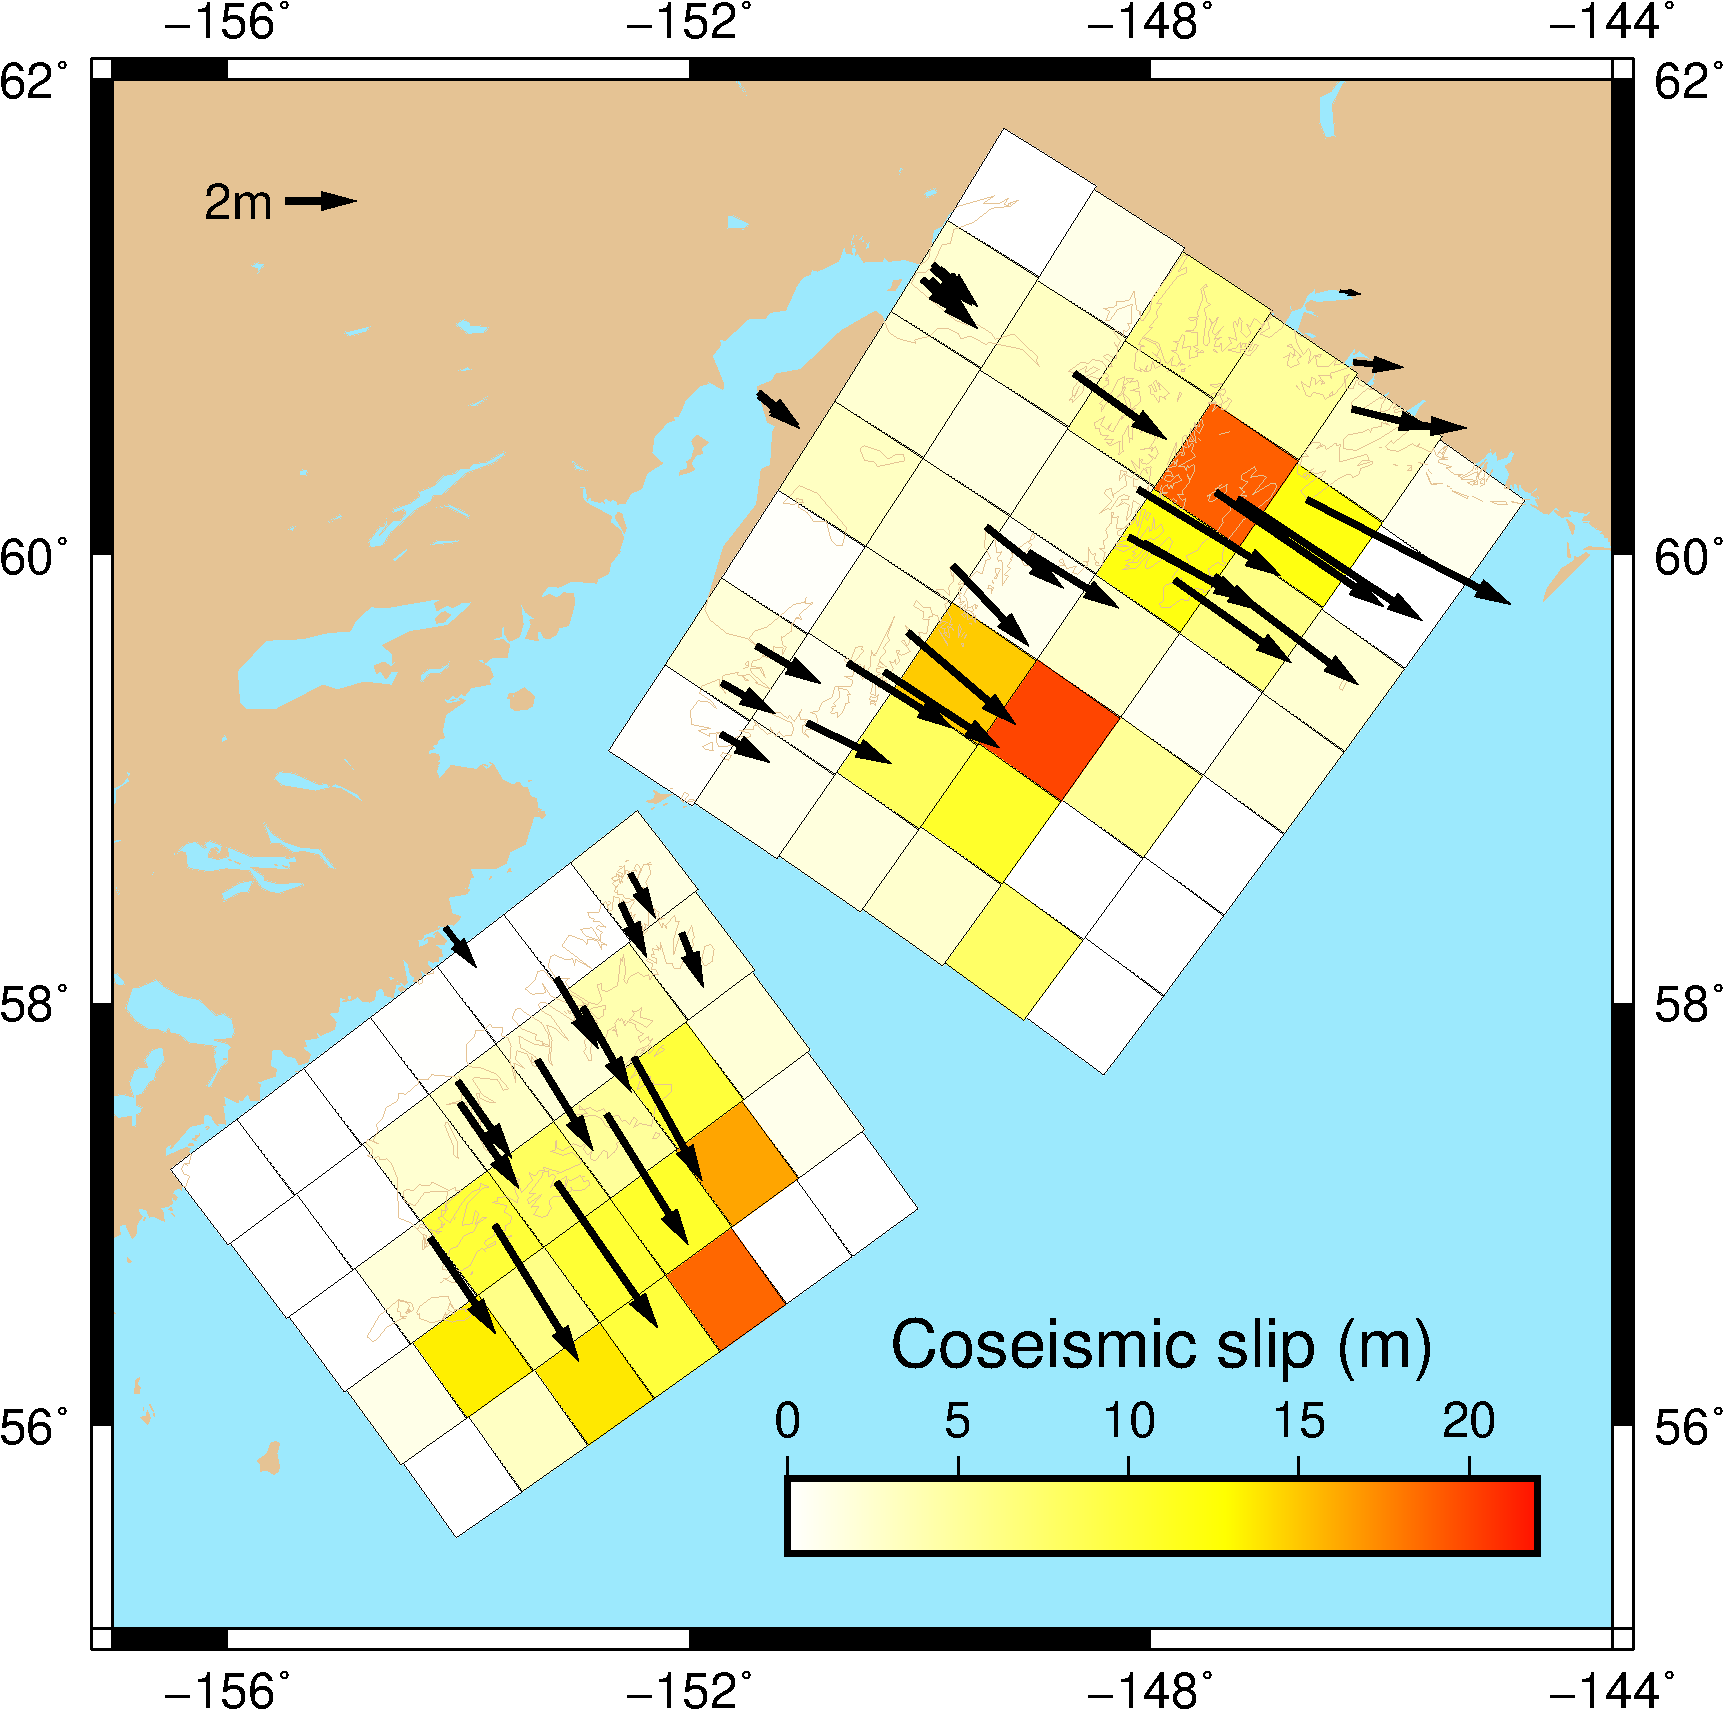
psxy- to plot fault geometry with fault slippscoast- to plot basemappsvelo- to plot GPS velocity
Material needed:
- Fault_geo1.dat: Fault geometry 1 with coseismic slip
- Fault_geo2.dat: Fault geometry 2 with coseismic slip
- GPS_coseis.dat: GPS data corresponding to the coseismic slip.
- Plot_fault.ksh: Plotting script.
Material Format
The format for Fault_geo*.dat is
1 | -Z ${slip magnitute} |
The format for GPS_coseis.dat is
1 | ${lon} ${lat} ${east_component} ${north_component} ${east_significant} ${noth_significant} |
Plotting script
Next we’ll mainly focus on our plotting script.
1. Give name to some initial parameters
1 |
|
2. Plot basic picture
1 | gmt makecpt -Chot.cpt -G0.4/1 -Ic -T0/22 > $cpt |
Using makecpt to define the colormap: Choose hot colormaphen, cut the range to 0.41 with 22m’s slip range with -G, invert colormap with -Ic, choose 0-G, finally output to $cpt.(see makecpt)
Using pscoast to plot the land and ocean with different color.(see pscoast)
3. Plot fault geometry
1 | gmt psxy $fault_geo1 -R$R -J$J -W0.1p -L -C$cpt -O -K >> $ps |
Here we use psxy to plot the fault geometry, giving different color to fault patches according to slip maganitude and assigned colormap.(see psxy)
And we plot the coast line again to avoid everything being covered by fault geometry.
4. Plot GPS vectors
1 | awk '{print $1,$2,$3,$4,$5,$6,0.0}' ${gps_name} |\ |
We use psvelo to plot GPS displacement with the first two lines.(see psvelo)
The left 5 lines are used to plot displacement’s legend.
5. Convert to png
1 | gmt psconvert $ps -A -Tg |
Finally, we can convert the .ps file to .png file for better Visualization and remove files we don’t need anymore.
The output picture should looks like this.